I built a CLI that ranks React components by render cost
Every React app has that one component. The one that feels janky when you type, or makes a list stutter when you scroll. You think you know which one it is. You're often wrong.
The React DevTools Profiler is great, but it's a flame graph — a timeline you scrub through, commit by commit, eyeballing colored bars. It answers "what happened in this one interaction." What I usually want is blunter: across a whole session, which components cost the most to render? Rank them. Put the worst one at the top. Then let me watch that number over time.
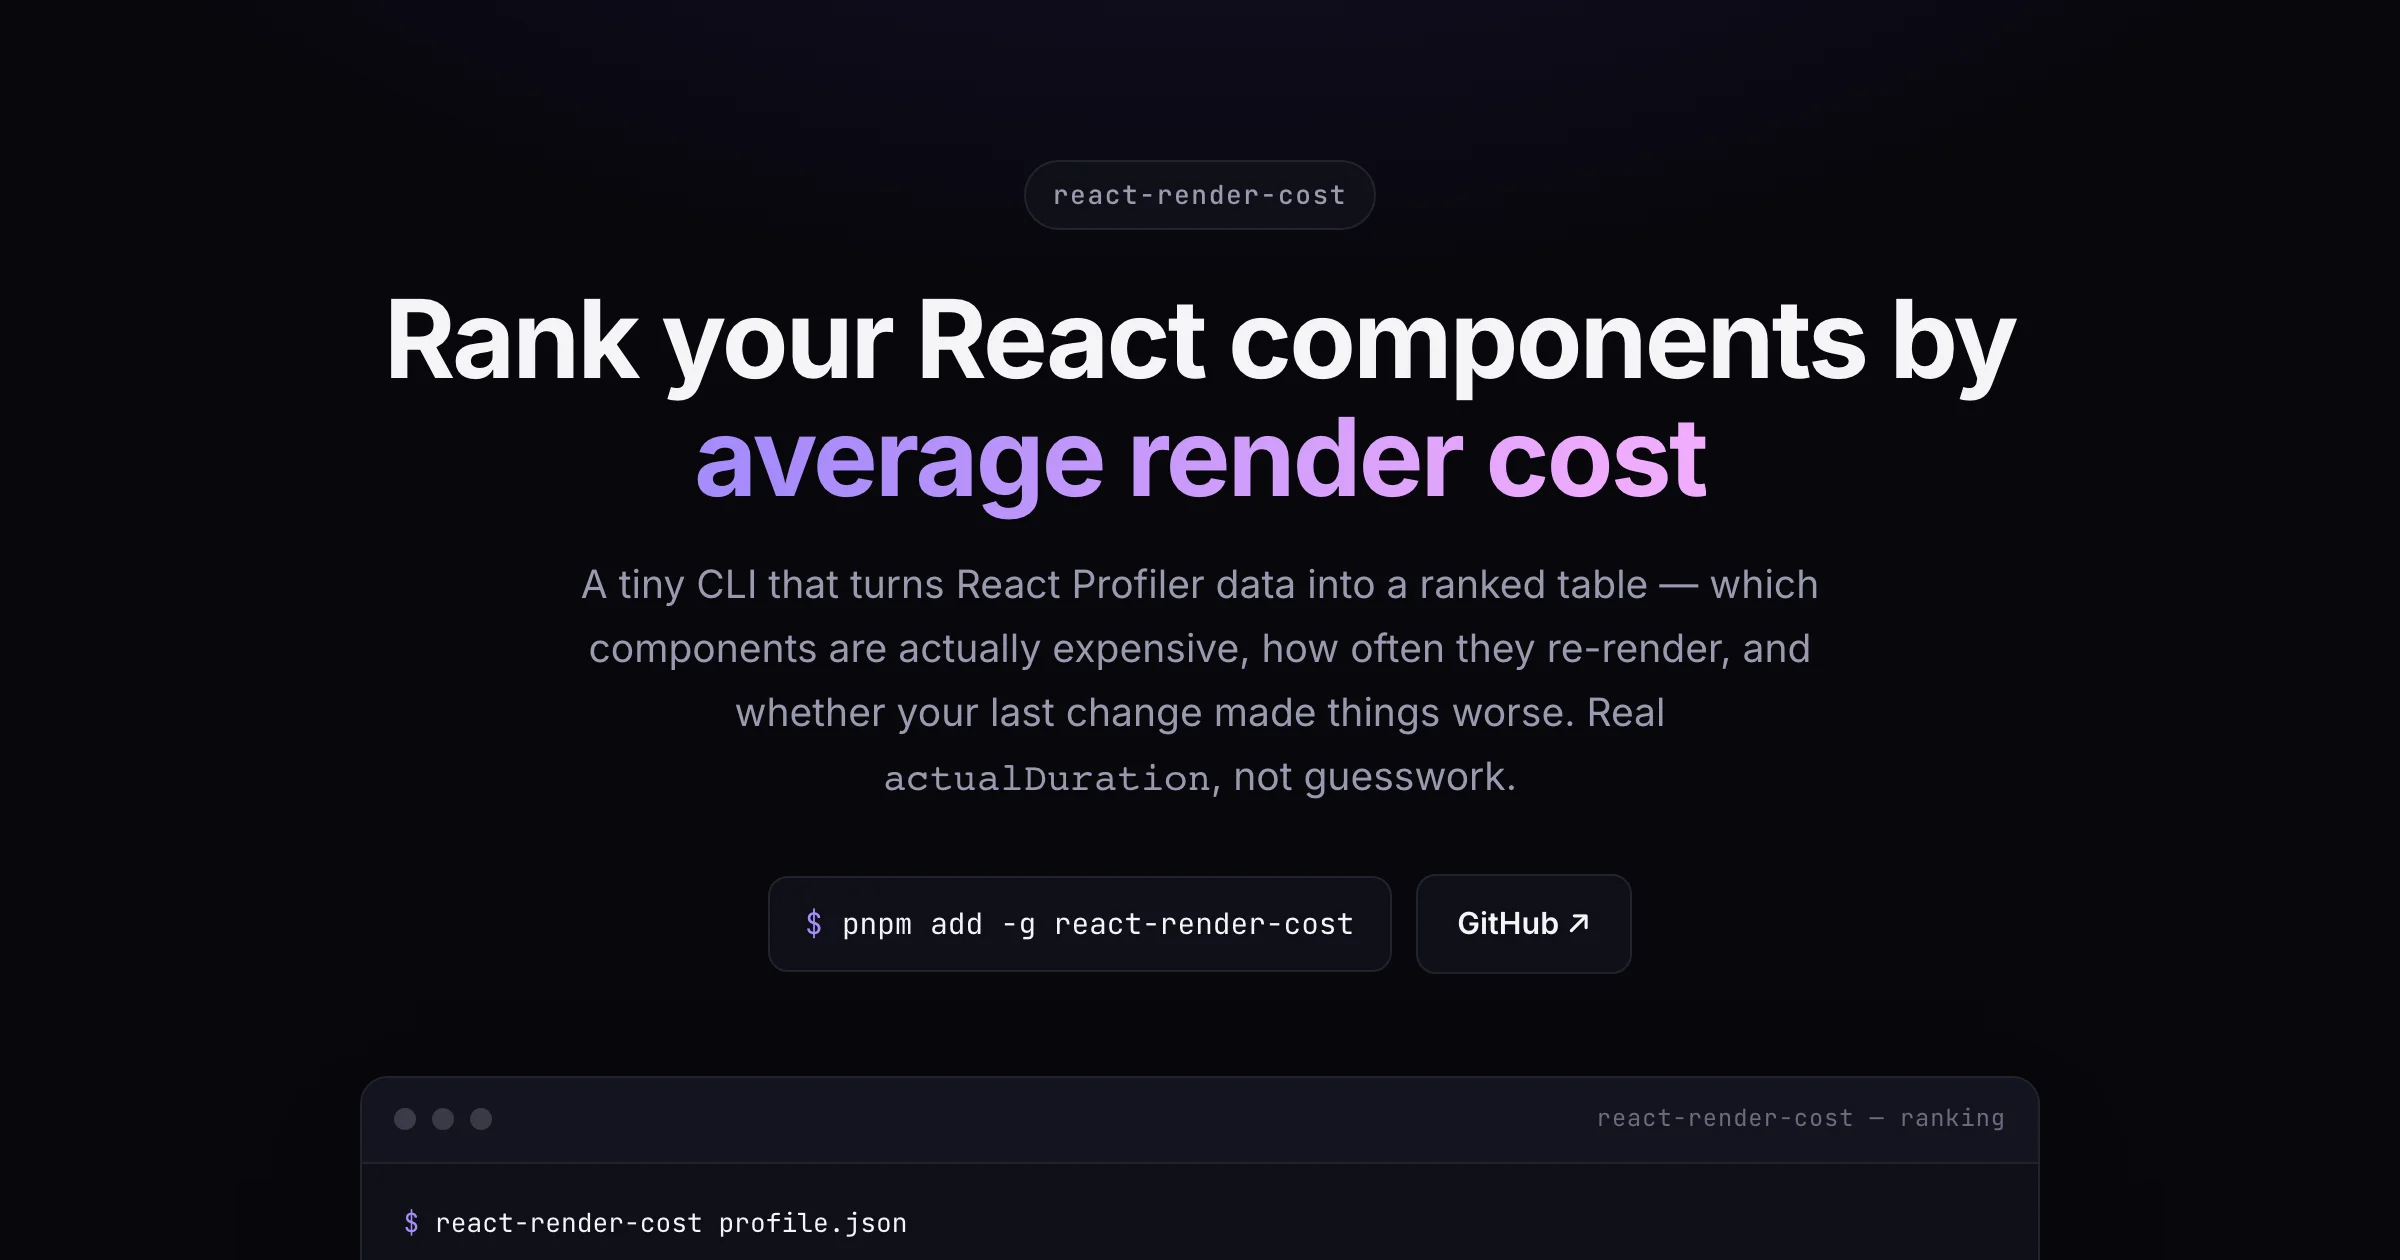
So I built react-render-cost — a tiny CLI that does exactly that.
What it does
React already hands you the data. Wrap any part of your tree in a <Profiler> and it calls onRender on every commit with the numbers that matter — actualDuration (how long this render took), phase (mount vs update), and a component id:
import { Profiler } from 'react';

const samples = [];
const record = (id, phase, actualDuration, baseDuration) =>
  samples.push({ id, phase, actualDuration, baseDuration });

// <Profiler id="MessageList" onRender={record}> ... </Profiler>
// dump `samples` to profile.json whenever it suits you
Point the CLI at that JSON and you get a ranked table:
$ react-render-cost profile.json

profile.json — 5 components, 9 renders

  #  component    avg ms  max ms  renders  m/u  total ms
  ─  ───────────  ──────  ──────  ───────  ───  ────────
  1  MessageList   14.07   18.40        3  1/2     42.20
  2  Composer       5.80    6.20        2  1/1     11.60
  3  Sidebar        4.10    4.10        1  1/0      4.10
The m/u column (mounts / updates) is the tell I reach for most — a component with a modest average but a huge update count is usually the real problem. Sort by total instead of avg and you find what's eating the most wall-clock overall.
Two flags turn it from a viewer into a guardrail. --budget 10 exits non-zero if any component's average blows past your ceiling, so a slow render can fail a pull request. And --baseline main.json diffs the current run against a saved one — regressions in red, wins in green — and exits non-zero if anything got slower:
  component    baseline  current   Δ ms     %  status
  MessageList      7.10    14.07  +6.97  +98%  ▲ regressed
  Sidebar          4.20     4.10  -0.10   -2%  ▽ improved
How I built it
Decision one: analyze data, don't instrument the app. I could have shipped a runtime wrapper that hooks into your renderer. I deliberately didn't. Making the tool a pure function of captured data means it doesn't care whether you're on React 17 or 19, whether you use Vite or Next, or whether the capture came from a test, a real session, or a synthetic benchmark. The whole program is parse → aggregate → rank → render, and every stage is a plain function you can import and unit-test in isolation. The CLI is a thin shell around library code.
Decision two: design for 100% coverage, then earn it honestly. I set Vitest's thresholds to 100% across statements, branches, functions and lines — and refused to reach for /* c8 ignore */. That constraint quietly improved the code. Two examples:
- My input validator originally checked
typeof n === 'number' && Number.isFinite(n). But JSON numbers are always finite —JSON.parsecan't produceNaNorInfinity. ThatisFinitebranch was literally unreachable, which coverage flagged as a hole I could never fill. The fix wasn't a test; it was deleting a check that could never fire. - For sorting by a chosen metric, the obvious move is a
switch. But an exhaustive switch over a validated union still needs adefaultfor the type-checker, and that default is dead code. I swapped it for a lookup map —{ avg: s => s.avg, total: s => s.total, ... }— which has no branches at all. Each entry is a function the tests simply call. Cleaner and fully covered.
The CLI itself is tested by injecting its I/O — readFile, log, env are all passed in, and run() returns an exit code instead of calling process.exit. So a test is just "give it these argv and this fake filesystem, assert on the captured output and the returned code." No spawning, no temp files, no mocking the process.
Try it
pnpm add -g react-render-cost
# or run it once, no install:
pnpm dlx react-render-cost profile.json
It installs as both react-render-cost and the shorter rrc. Everything the CLI does is also exported as a library (parseSamples, aggregate, rank, diff) if you'd rather build profiling into your own tooling or a custom CI annotation.
What's next
A few things on my list: reading React DevTools' native profiler export format directly (so you can skip the manual <Profiler> wrapper), a --group mode to roll costs up by feature or route, and a Markdown reporter for dropping a render-cost table straight into a PR comment.
If you give it a spin and it surfaces a component you didn't expect at the top — I'd genuinely love to hear about it.
End of essay